This case study aims at helping the manager of one the most important automotive manufacturing plant in eastern France to evaluate different configurations (manufacturing tasks assigned to buildings) for the production plant. Different configurations are characterized by different flows of car materials moved in the plant. These materials are inputs of production buildings where some manufacturing work is done on them. Then trucks convey the transformed materials to other buildings where the next manufacturing activity will be performed. Raw or partially manufactured materials enter the plant carried by trucks.
Case study Description: Simulation of an Industrial Plant
A case study will be used throughout this paper for exemplifying the activities and artifacts composing the proposed design process. The case study deals with the analysis and modeling of one the most important industrial plant of eastern France. The plant belongs to a major automotive manufacturer, it is greater than 250 hectares, and, as most industrial plants, it is in perpetual evolution. The plant that produces over a 1700 cars per day, requires constant improvements and expansions in order to handle the increasing demand of vehicles worldwide. As the production grows new buildings need to be built and production units relocated.
The production chains are located inside buildings that exchange their products by using trucks. These trucks have predefined tours inside the plant. Buildings exchanging materials on a regular basis constitute a so called Building Cluster. Identifying these clusters can be a useful tool when redefining the trucks’ routes and even more important when planning an infrastructure modification. Infrastructure modifications include positioning inside existing buildings the different workshops required by the material-processing plan. Each workshop usually receives materials from outside the plant (raw materials) and/or another workshop.
Any change in the location of one workshop could generate perturbations on the traffic flow and on the smooth functioning of the plant as a whole. Conversely, the proper positioning of workshops in the existing buildings is an important optimization activity that can result in an improved production for the overall plant. The study of the traffic flow changes resulting from a different deployment of the required workshops allows the identification of functional dependencies in the plant and the estimation of the impact of relocating production units on the overall plant productivity.
This plant, containing even an internal railway, can be seen as a small town with a high traffic density. The plant counts with over 19000 employees working in different shifts to ensure that the plant produces 24 hours a day. Last year an average of over 1600 trucks entered the plant every day carrying supplies. Geographically, the plant is enclosed by three cities and a highway. Such a configuration makes difficult to increase the plant’s size for accommodating new buildings, thus forcing to redesign the infrastructure when new needs arise. Due to the great number of constraints and interrelated dependencies between traffic and production, a simulation tool could be of great help when evaluating different design choices. Even the smallest modification in a plant of this size often requires a significant budget to be invested. A reliable simulator offers the possibility of detecting “side-effects” before the project approval.
Our system aims to provide a set of tools to support the decision maker in preparing infrastructural modifications (such as new buildings or parking spaces, relocation of workshops, road planning, etc.) or when changing functional elements, like trucks’ schedules and routes.
Such an industrial plant can be seen as a distributed system. A vast number of entities interact and the global behavior of the system is made of several emergent phenomena resulting from these interactions. Multi-Agent Systems (MAS) are well adapted to handle this type of systems. Indeed, the agent abstraction facilitates the conception of distributed microscopic models [2]. However, simulation of microscopic models may be inefficient when there are a great number of entities in the model. Moreover, multiple views of an unstructured model may be difficult to integrate. In order to deal with both these two problems we adopted the proposed holonic approach.
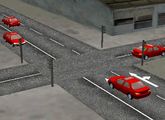
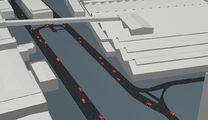
The simulator developed offers a microscopic agent-based simulation of an industrial plant. It provides a set of indicators concerning congestion, jams, exchange of products between buildings, etc. A connection with a Virtual Reality (VR) platform was realized to offer the possibility of visualizing the simulation is real-time using 3D technology (see Figure 1).
This case study exhibits several properties that make it the ideal case study for the application of the ASPECS design process:
- Openness: Trucks and cars enter and exit freely in the scenario. The number of involved trucks is not a priori known.
- Complexity: Workshops are a priori positioned and their positions are fixed for each scenario. During the execution of each scenario, workshops are dynamically clustered in the above-introduced Building Clusters, according to the volume of materials exchanged among them. Intuitively, the optimal solution consists in positioning workshops in the same building or buildings that are nearby. The complexity of the problem arises from the fact that all workshops are some way related and therefore a modification in just one cluster may impact all the others.
- Dynamic: The route of each truck is not a priori determined. The expected transit schedule has to be dynamically adapted to face delays and contingencies in production.
Workshop clusters are dynamically identified and may evolve according to the scenario events flow. This mean that workshops may enter and exit clusters at runtime.
In the following section we start detailing the application of the ASPECS design process on the proposed case study. The description begins with a section reporting the activities of the System Requirements phase and then continues with other two sections describing the other two phases: Agent Society and Implementation and Deployment.
System Requirement Analysis
Domain Requirements Description (DRD)
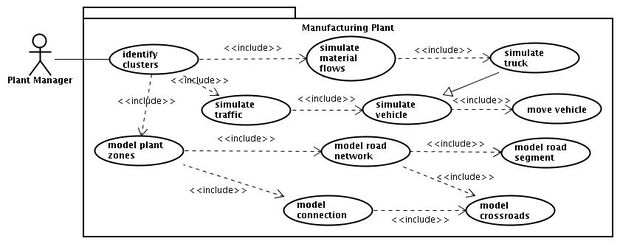
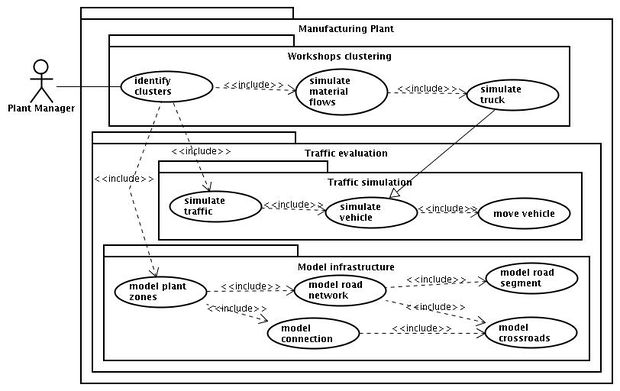
Figure 2 details the use cases associated to a portion of the AMP case study. Eleven use cases and one actor have been identified. The actor represents the manager of the manufacturing plant that will use this system as a decision support tool. The manager actor has two main requirements for the system. The first consists in identifying groups of buildings with important materials exchange (Identify clusters use case). This information is of great importance in order to optimize the production chain. It also has an important impact on traffic since a relevant material exchange between two workshops implies a significant traffic flow between them. The second requirement (that is someway related to the first one) concentrates on the evaluation of vehicle traffic inside the plant (Simulate traffic use case). The goal is to identify and look at “traffic related” components, like roads, vehicles, traffic lights, etc. This also requires modeling the topological structure of the plant. Traffic simulation also concerns the identification of parameters that will provide meaningful information to estimate the congestion, possible jams, etc.
Problem Ontology Description (POD)
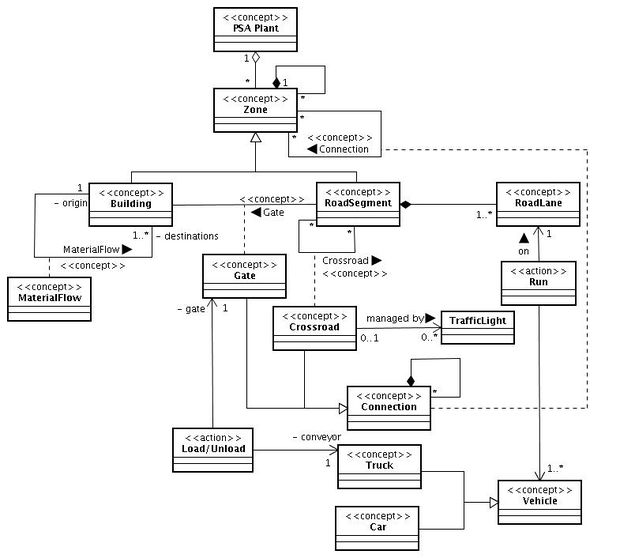
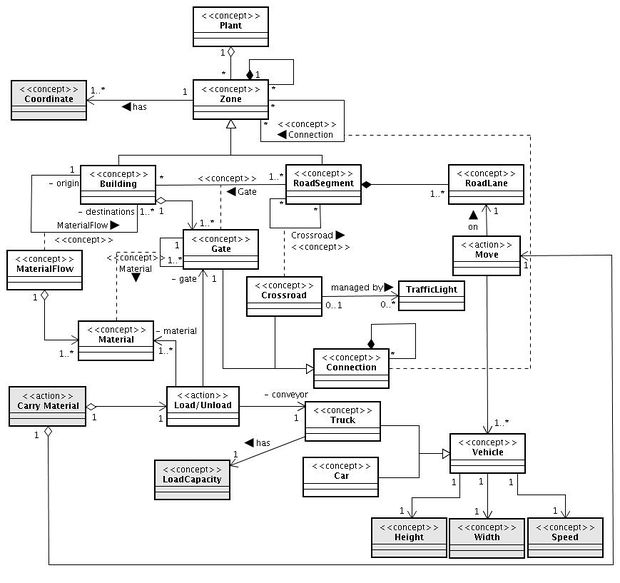
Problem Ontology of AMP decision-support tool is depicted in Figure 3. This ontology includes a Plant concept which represents the entire plant. This concept is composed of zones that can be decomposed in smaller zones thus describing an area which may be refined to the granularity of a building or a road segment. Each zone is linked to adjacent zones by connections. A connection can be refined in either a gate (if one of the two zones is a building or the road segment is located at the border of the plant) or a crossroad. Vehicles move on road-lanes that compose the road segments and there is a specific type of vehicle, namely Truck, that can carry materials between buildings; other vehicles (for instance cars and buses) do not carry materials and only contribute to traffic congestion.
Organisation Identification (OID)
The use case diagram presented in Figure 4 presents a part of the organization identification diagram. For example, use case Simulate Traffic, SimulateVehicle and Move Vehicle are clustered in the Traffic simulation organization according to a functional identification of the resulting Traffic Simulation organization.
Interactions and Role Identification (IRI)
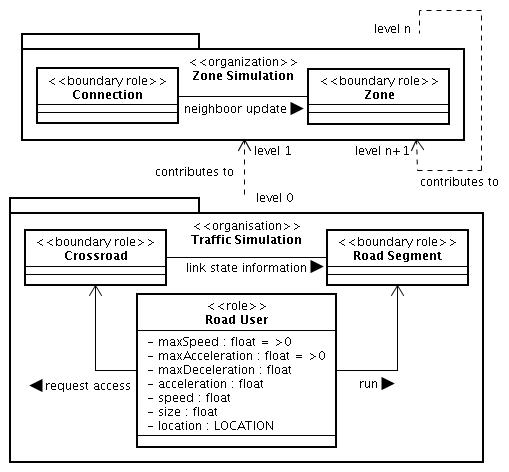
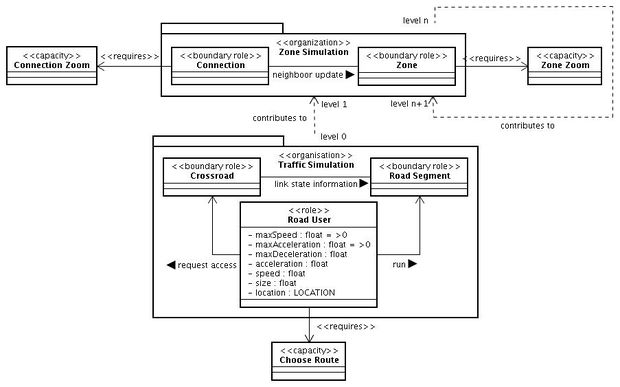
We will now focus on the Traffic simulation organization of the AMP case study, that is located at this finest level of granularities in the hierarchical decomposition of the plant. This organization can be decomposed in three roles (see Figure 5): Road User which is a Common Role and Crossroad and RoadSegment which are Boundary Role. A Road User can run on a RoadSegment and cross a Crossroad if the environmental conditions allow it (for instance no other Road User is crossing a Crossroad at the same time).
The Zone simulation organization correspond to the other levels of granularities in the hierarchical decomposition of the plant. This organization can be recursively used to decompose behaviors until we reach the lowest one that is modeled by the Traffic simulation organization. The Zone simulation organization is composed of two roles: Connection and Zone. As stated in the ontology, a Zone can be decomposed in smaller Zones (and in turn decomposed in Road Segments and Crossroad at the lowest level). The simulation of a Zone can then be the result of the simulation of smaller Zones. This contribution relationship is also depicted in Figure 5 using an UML constraint named "contributes to".
Scenario Description (SD)
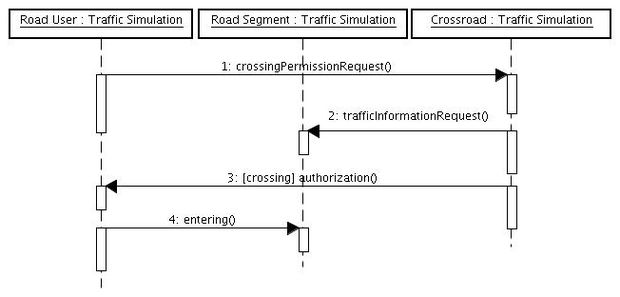
For the already proposed Traffic simulation organization the scenario described in Figure 6 corresponds to a Road User trying to cross a Crossroad. First it requests a permission to the Crossroad. The Crossroad first checks if the required crossing is compliant with the local traffic rules (prescribed directions, obligatory turns, etc.) and then requests traffic information to the next RoadSegment (the destination one). If entering the new Road Segment is possible then the Crossroad grants the permission to the Road User which crosses it.
Role Plan (RP)
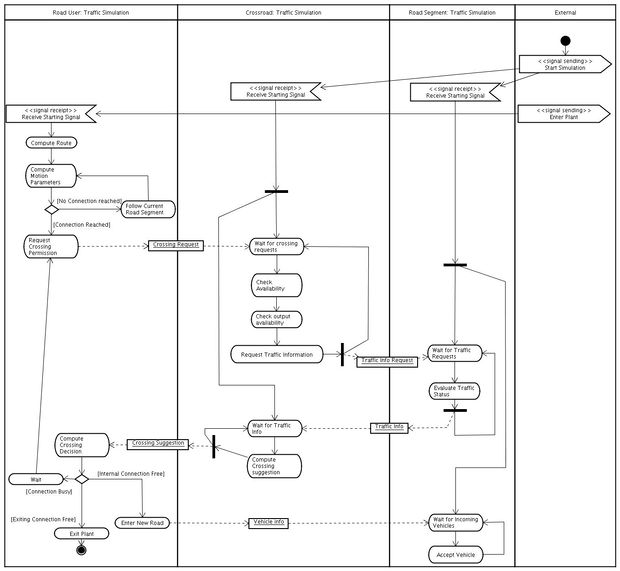
Figure 7 reports an example of a Role Plan diagram. It depicts the plan of the Traffic simulation organization starting with an external signal which indicates the beginning of the simulation. After that, the Road User computes a route and the corresponding motion variables according to the chosen route; it follows on until a Crossroad is reached. When the Road User reaches a Crossroad, it asks the Crossroad for a crossing permission. The Crossroad grants the permission if the Crossroad is available and if the Road Segment destination is not jammed. The Crossroad sends a suggestion to the Road User which takes the final decision. If the RoadUser exits the plant it is destroyed, if not and the Crossroad is free then the Road User crosses it and informs the new road of its entrance. Else, if the Crossroad is busy it waits. The plan of the Road Segment consists in waiting for information requests (for instance about traffic) and incoming RoadUsers.
Capacity Identification (CI)
In Figure 8, roles of the Traffic Simulation and Zone Simulation organizations are linked to three capacities. An entity playing the Road User role must own the ChooseRoute capacity. This capacity allows the computation of a route between two points according to environmental constraints. Entities playing the Connection and Zone roles must have a capacity allowing to zoom (for enabling the decomposition in smaller zones).
Agent Society Design
Solution Ontology Description (SOD)
As regards the proposed case study, in order to fully support the physical model of vehicles moving in the plant, we obtain Figure 9 by adding to the ontology of Figure 3 concepts concerning features of a Vehicle such as Height, Width, Speed or LoadCapacity for a Truck. Each Zone is now defined by a set of coordinates.
At the end of the Solution Ontology Description activity, the ASPECS development process is split up into two development sub-branches, the first and foremost is dedicated to the organizational design of the system, the second one is dedicated to the identification and design of agents composing the system. In other words, the main branch deals with the design of the organizational structure of the system and collective goals that have to be satisfied by agent, while the second branch deals with agent’s personal goals and motivations, and it aims at defining such agent architecture. The two branches are then merged to describe the complete holarchical structure of the system and the individual agent decision plan. In the following subsections we will initially describe activities related to agents design and then the organizational ones. This corresponds to building the holarchy in a bottom-up way. This is not a prescription of our proposed approach but only a presentation choice. The designer is free of choosing their preferred branch and even interleaving the activities of the two branches. The Agents Identification activity is the first activity of the agent design and it will be discussed in the next section.
Agent Identification (AI)
Figure 10 describes the Vehicle and Truck agents of the AMP Case study and their respective responsibilities using a TROPOS Goal diagram.
Agent Architecture Description (AAD)
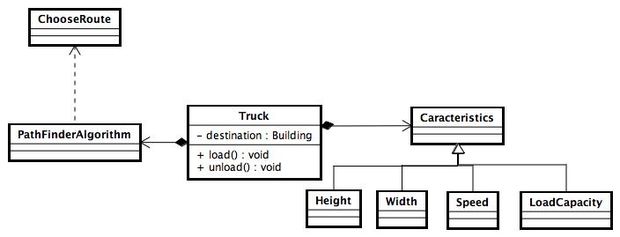
The Truck agent architecture sketched in Figure 11 consists mainly in an implementation of a Path Finder Algorithm which realizes the Choose Route capacity and characteristics such as Height, Speed, …
Communication Ontological Description (COD)
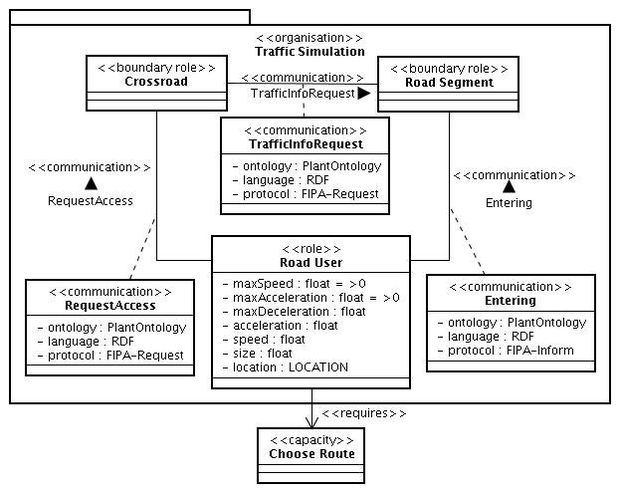
Figure 12 describes some communications of the AMP Traffic Simulation Organization. For example, each Road User role-player may send an Entering communication following the FIPA-inform speech act, using the Solution Ontology previously described and encoded in RDF.
Role Behavior Description (RBD)
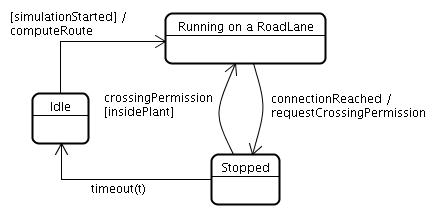
Figure 13 describes the behavior of the Road User Role. By default it is idle just the time for computing a route (the transition without event). Once the route is computed it is running on a road lane. This state remains active until a crossroad is reached. When such an event occurs the role sends a requestCrossingPermission message and enters the waiting state. When the crossingPermission reply is received the role either continue in the running on a road lane state if it is still in the plant or exits the plant. If no answer is provided before a timeout, the Road User computes a new route.
Organisation Dependencies Description (ODD)
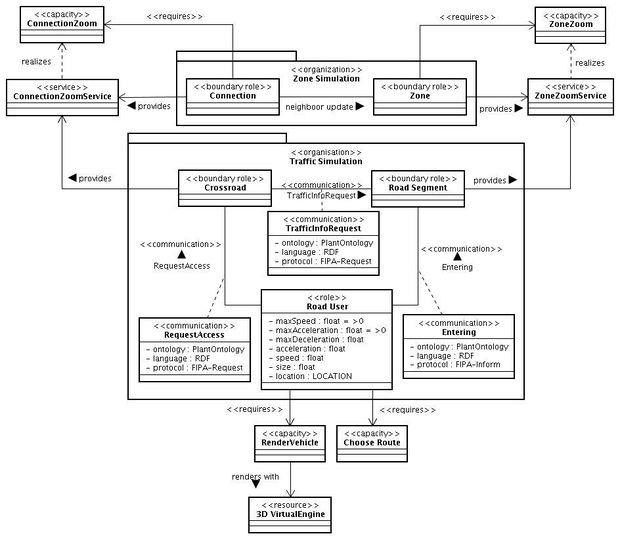
The resulting diagram, as exemplified in Figure 14, is a UML class diagram, reporting roles (clustered in organizations), communications, services, capacities and resources. It can be seen as a refinement of the COD (Communication Ontological Description) diagram including services and resources. Figure 14 describes dependencies of the Traffic Simulation organization. One new resource has been identified (it represents a 3D virtual engine), and the RenderVehicle capacity has been created to manage it. It is interesting to note that this capacity does not need a service realization because the corresponding functionality is internal to the RoadUser role that does not need to publish it as a service. It is the same for the Choose Route capacity. The Connection Zoom and Zone Zoom capacities have service realization since the zooming is done by mean of sub-holons contribution.
Role Constraints Identification (RCI)
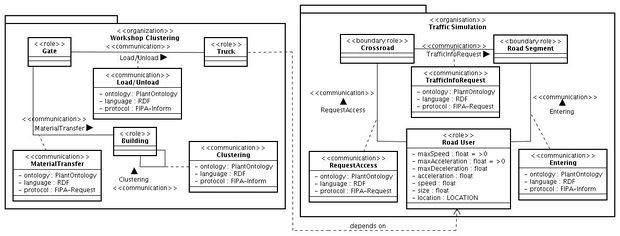
In the presented case study, if an agent play the role Truck, he must play at the same time the role Road User. This type of constraints is modeled using a stereotyped UML dependency from the Truck and Road User classes, as illustrated by Figure 15. The direction of the dependency means that the Truck role required that its player plays already the Road User role.
Agent Plan Description (APD)
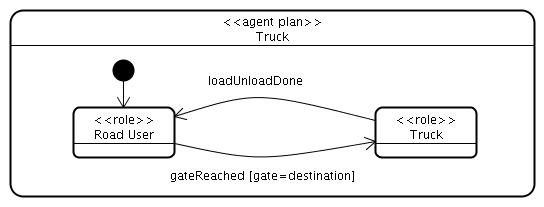
Truck agent plan is illustrated by Figure 16. The Truck agent plays two role, namely Road User and Truck. By default it plays the Road User role and if it reaches a Gate it decides to play the Truck role. When the load/unload operations are finished it returns playing the Road User role.
Holarchy Design (HD)
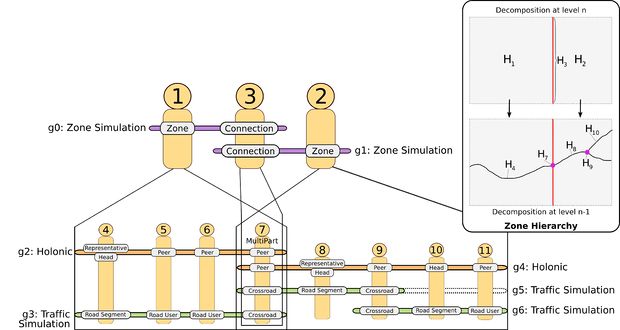
A fragment of the final structure of the holonic solution of the AMP case study is presented in Figure 17 using a holonic cheese-board diagram (extended version of cheese-board diagram initially proposed by [1]). This diagram is associated to a map describing two levels of the associated topological decomposition of two zones of the plant that are modeled in the application by holons 1 and 2. At the second level of the holarchy, three super-holons (1, 2 and 3) are playing roles into two groups g0 and g1. The denomination g0: Zone Simulation indicates that group g0 is an instance of the Zone Simulation organization. Holons 1 and 2 represent two plant zones that are linked using a connection embodied by the holon 3 who enables to maintain statistic about materials flows between the two adjacent zones. Each of these super-holon contains at least one instance of Traffic Simulation organization (g3, g5 and g6) in charge of the simulation of truck and vehicle traffic inside the zone and a holonic group defining their governmental structure. Each Zone holon disposes of a simple type of government inspired by the oligarchy where command is centralized in the hands of a group of heads. The rule is that the holon playing the Road Segment role is automatically promoted Head and all heads elect one Representative among them. The agent 7 is shared in two super-holons (1, 2) and thus considered as a Multi-Part Peer. This holon constitutes the way to transfer vehicle between the two zone representing by the holons 1 and 2.
Implementation and Deployment
Holon Architecture Definition
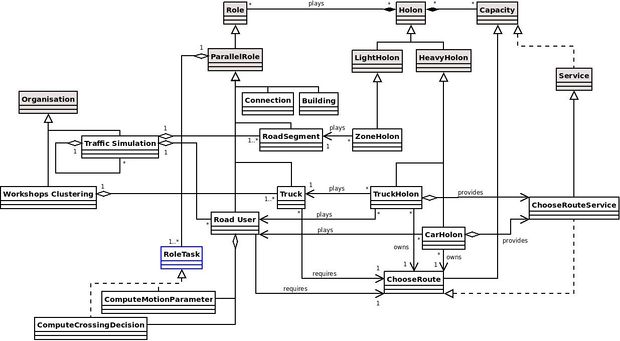
Figure 18 depicts a part of the Holons architecture implied in the implementation of our AMP example. The environment parts were implemented as LightHolon. The Car and Truck agents are implemented as HeavyHolon. The Traffic Simulation and Workshop Clustering organizations are partially described in Figure 18. Only the role Car User is described in terms of RoleTask. Classes in gray correspond to classes of the solution domain of the ASPECS meta-model that are refined to introduce problem dependent artifacts.
Deployment Configuration
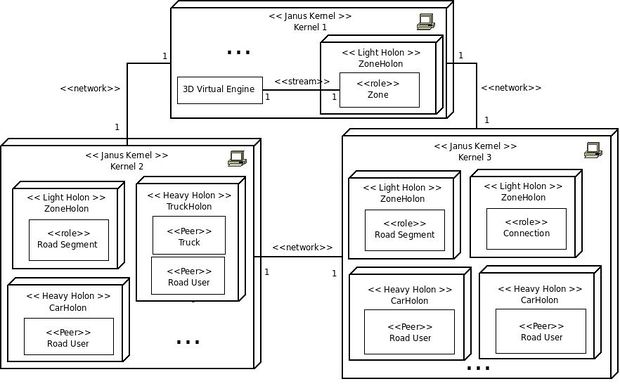
Figure 19 illustrates the deployment diagram for the AMP study case. Three physical nodes are considered; each of them is running a Janus kernel and is connected to the other nodes via a network connection. The first kernel hosts the 3D engine and the holons playing the Zone role that corresponds to the entire plant. All the other holons are a-priori affected on a specified kernel at initialization time. Of course the location of the holon on the JANUS kernel federation could evolve at runtime.
References
- [1] From Agents to Organizations: an Organizational View of Multi-Agent Systems
- J. Ferber, O. Gutknecht, and F. Michel.
In Agent-Oriented Software Engineering IV 4th International Workshop, volume 2935 of LNCS, pages 214–230, Melbourne, Australia. Springer Verlag. March, 2004.
- [2] Multi-Agent Approach to Modeling and Simulation of Urban Transportation Systems
- J. P. Gruer, V. Hilaire, and A. Koukam.
2001.In.

